Batumi in numbers
November 2026 edition
The key figures of Batumi's apartment market, taken from published research and drawn as charts you can reuse.
Price per m² by area
New turnkey apartments, weighted average, August 2026, US dollars
Source: Galt & Taggart, Batumi Residential Real Estate 8M 2026 overview (5 Nov 2026). Chart: BatumiBuyRent.com
Download the chart (PNG)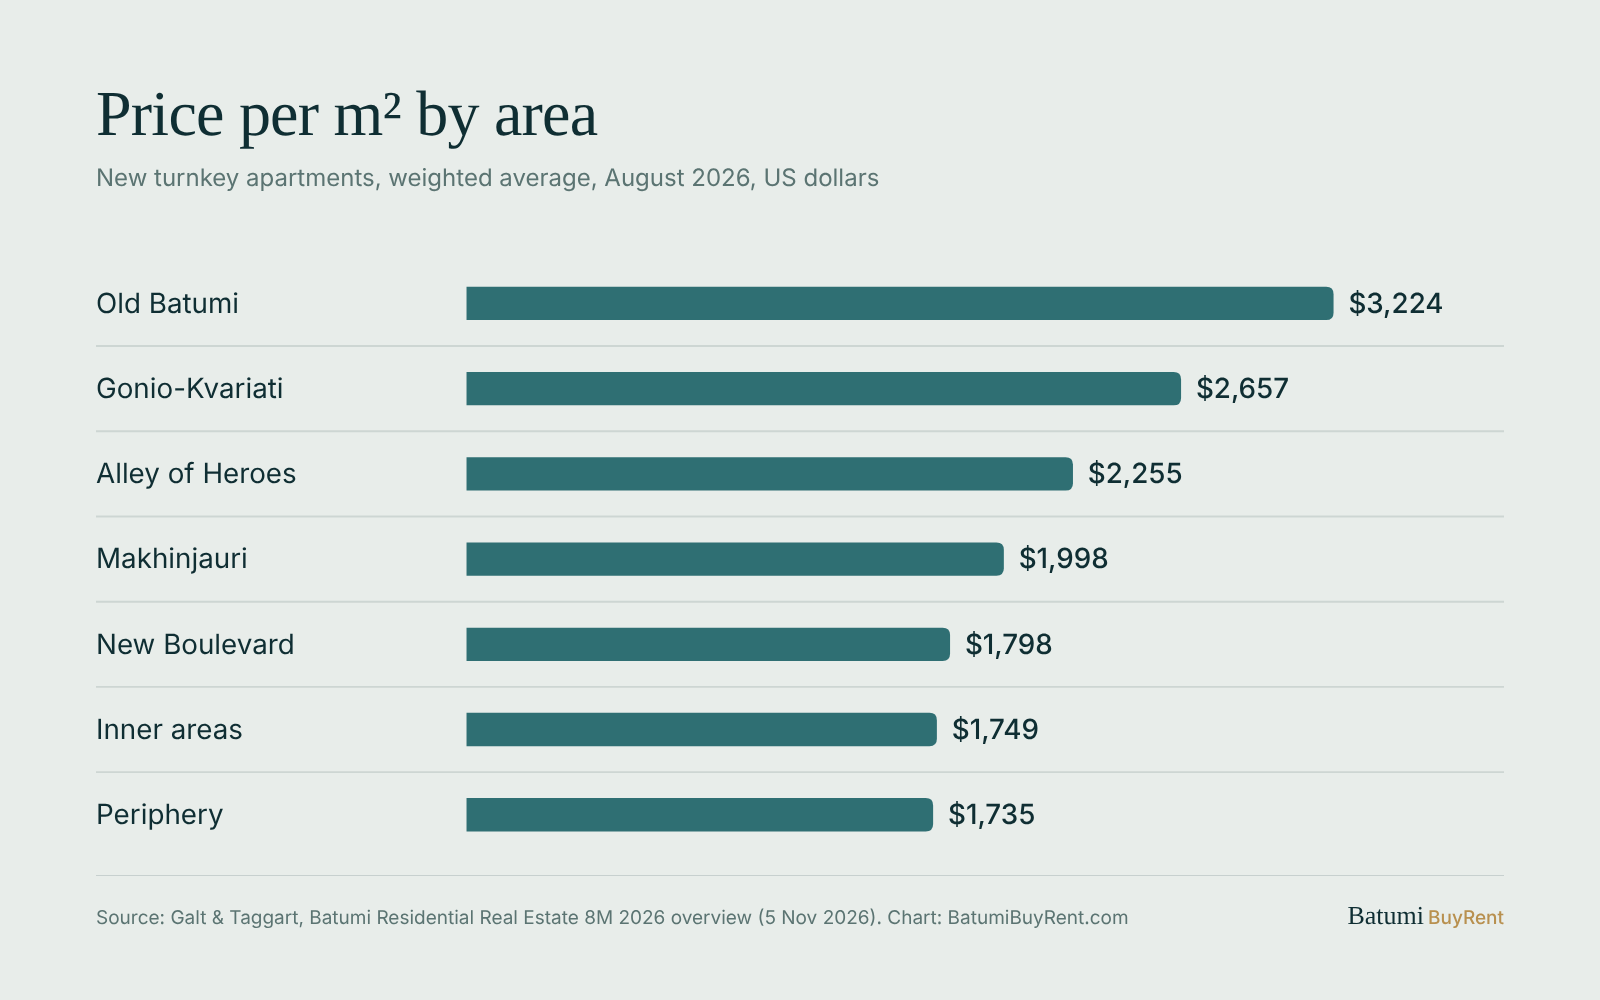
Price change in one year
Average price per m², June 2025 to June 2026
Source: Galt & Taggart, Batumi Residential Real Estate 2Q26 (14 Aug 2026). Chart: BatumiBuyRent.com
Download the chart (PNG)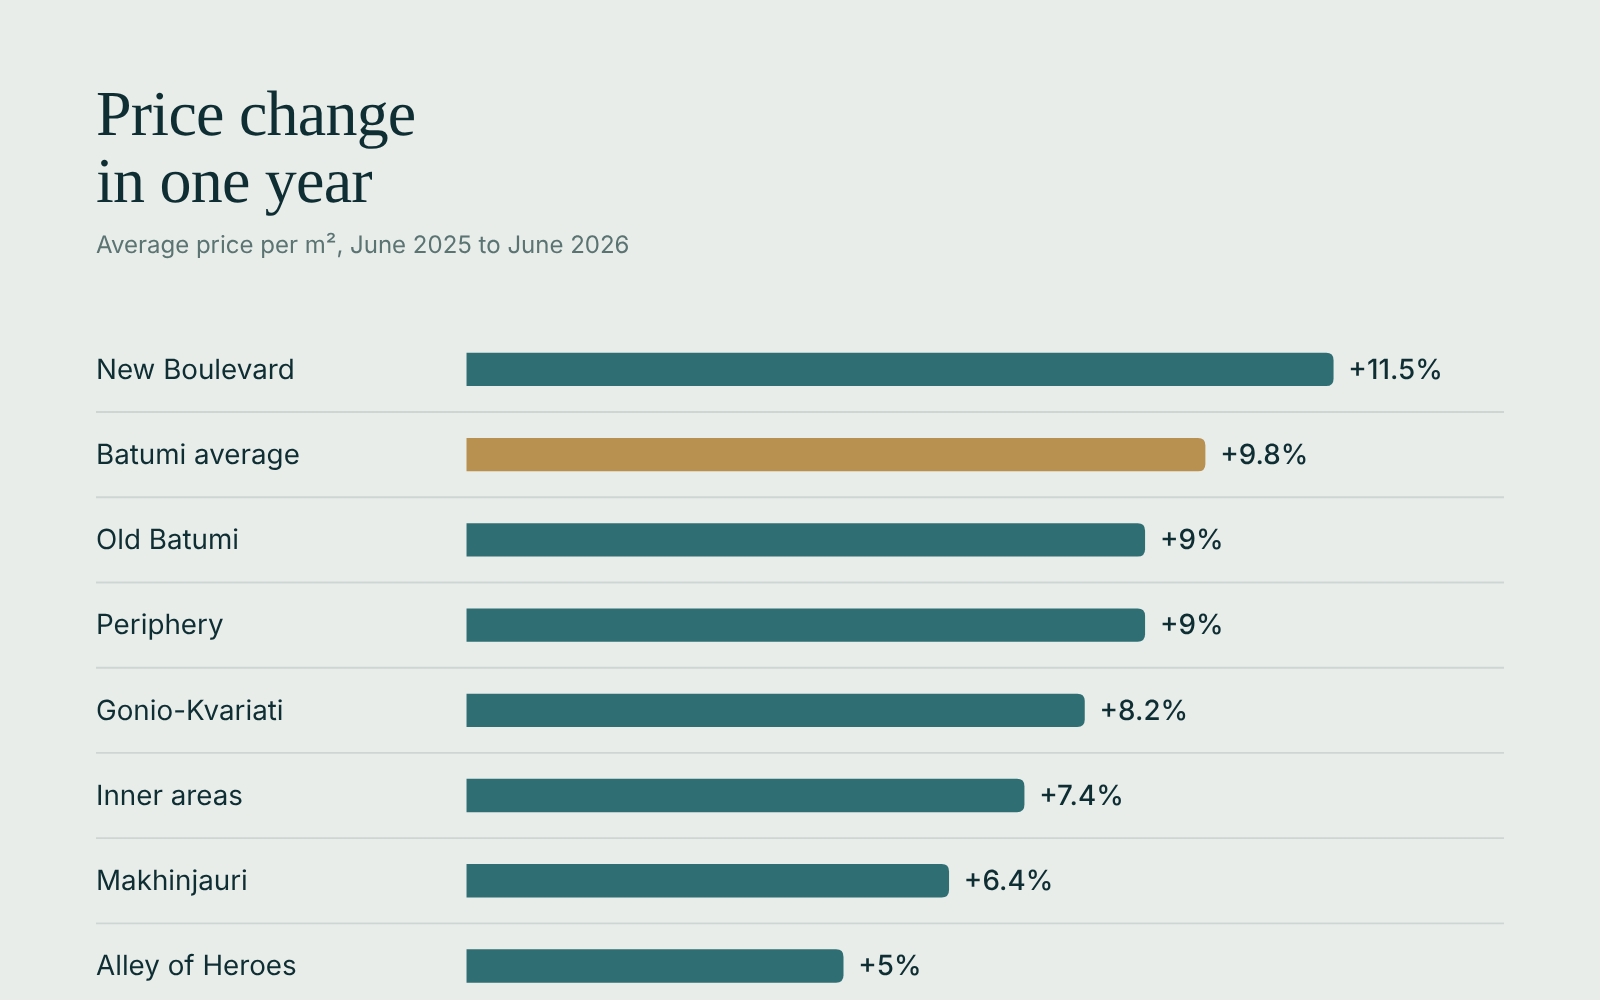
Where apartments sell
Apartments sold from January to August 2026, and change on the same months of 2025
Source: Galt & Taggart, Batumi Residential Real Estate 8M 2026 overview (5 Nov 2026). Chart: BatumiBuyRent.com
Download the chart (PNG)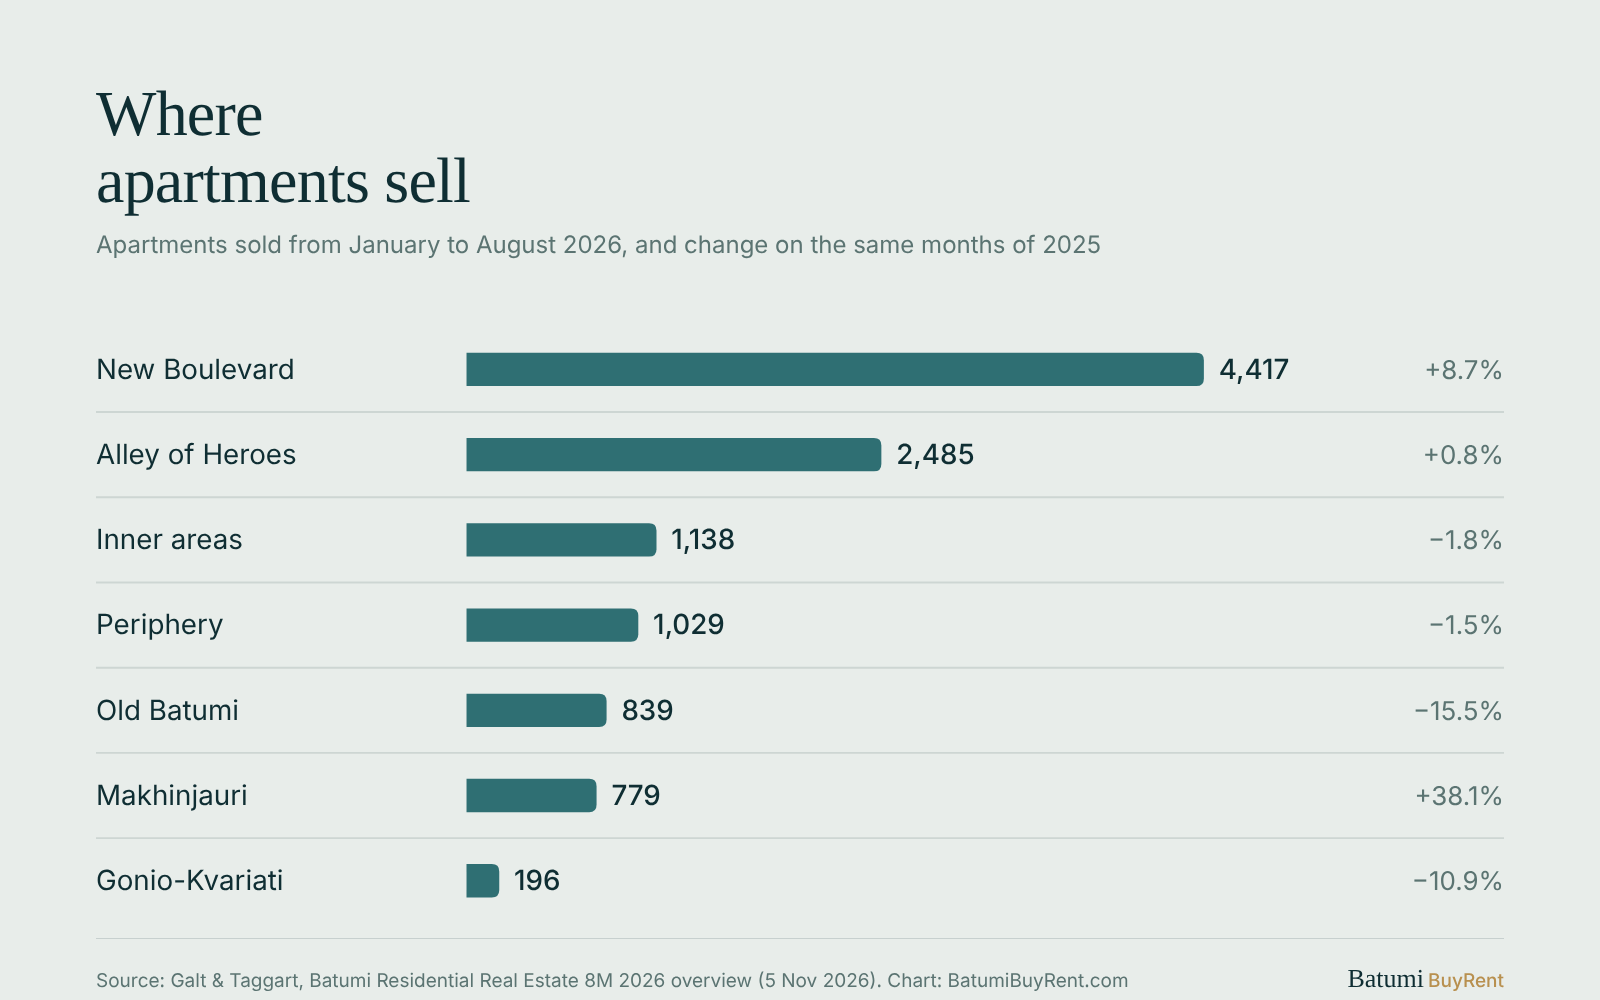
Areas are those defined by Galt & Taggart; they do not follow the official district boundaries. Inner areas and the periphery are groups of neighbourhoods, not single places.
Using these figures
Journalists, bloggers and researchers can reuse these charts and figures free of charge. Please credit “Source: Galt & Taggart; chart: BatumiBuyRent.com” with a link to this page.
Questions or another language: contact@batumibuyrent.com
Sources
Checked against the sources below in November 2026.
- Galt & Taggart — Batumi Residential Real Estate, 8M26 overview: rental yield (5 Nov 2026)
- Galt & Taggart via InternationalInvestment — average price and sales by area, January–August 2026 (9 Nov 2026)
- Galt & Taggart via InternationalInvestment — sales by district and change on 2025, January–August 2026 (7 Nov 2026)
- Galt & Taggart — Batumi Residential Real Estate, 2Q26: prices by district, June 2025 and June 2026 (14 Aug 2026)
This guide is general information, not legal or tax advice. Rules and fees change: confirm your case with a lawyer or accountant in Georgia.
Share this page